SDG India Index and Dashboard 2020–21
Contents
Context:
Recently, the third edition of the Sustainable Development Goals (SDG) India Index and Dashboard 2020–21 was released by NITI Aayog.
About SDG India Index:
- The NITI Aayog launched its index in 2018 to monitor the country’s progress on the goals through data-driven assessment, and foster a competitive spirit among the States and Union Territories in achieving them.
- The SDG India Index 2020–21 is developed in collaboration with the United Nations in India.
- The report titled,SDG India Index and Dashboard 2020–21: Partnerships in the Decade of Action
- NITI Aayog has the twin mandate to oversee the adoption and monitoring of the SDGs in the country, and also promote competitive and cooperative federalism among States and UTs.
- The index represents the articulation of the comprehensive nature of the Global Goals under the 2030 Agenda while being attuned to the national priorities.
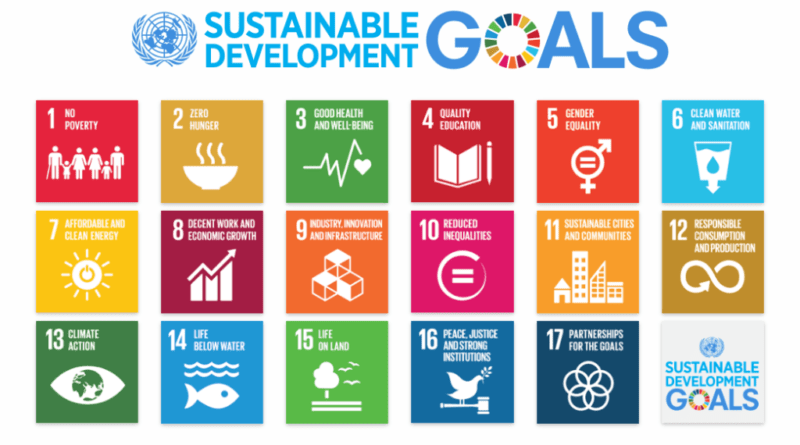
- In 2015, the UNs General Assembly adopted the 2030 Agenda for Sustainable Development.
- The 17 SDGs are a bold commitment to finish what the Millennium Development Goals (MDGs) started, and tackle some of the more pressing challenges.
- The SDG India Index 2020–21 is also live on an online dashboard, which has cross-sectoral relevance across policy, civil society, business, and academia.
- The SDG India Index 2020–21 is more robust than the previous editions on account of wider coverage of targets and indicators with greater alignment with the NIF.The 115 indicators incorporate16 out of 17 SDGs, with a qualitative assessment on Goal 17,andcover 70 SDG targets. This is an improvement over the 2018–19 and 2019–20 editions of the index, which had utilised 62 indicators across 39 targets and 13 Goals, and 100 indicators across 54 targets and 16 Goals, respectively.
Methodology

The SDG India Index computes goal-wise scores on the 16 SDGs for each State and Union Territory. Overall State and UT scores are generated from goal-wise scores to measure aggregate performance of the sub-national unit based on its performance across the 16 SDGs. These scores range between 0–100, and if a State/UT achieves a score of 100, it signifies it has achieved the 2030 targets. The higher the score of a State/UT, the greater the distance to target achieved.
States and Union Territories are classified as below based on their SDG India Index score:
- Aspirant: 0–49
- Performer: 50–64
- Front-Runner: 65–99
- Achiever: 100
Comparison with Previous Editions:
- The SDG India Index 2020–21 is more robust than the previous editions on account of wider coverage of targets and indicators with greater alignment with the National Indicator Framework (NIF).
- The 115 indicators incorporate 16 out of 17 SDGs, with a qualitative assessment on Goal 17, and cover 70 SDG targets.
- This is an improvement over the 2018–19 and 2019–20 editions of the index, which had utilised 62 indicators across 39 targets and 13 Goals, and 100 indicators across 54 targets and 16 Goals, respectively.
National Analysis:
- The country’s overall SDG score improved by 6 points – from 60 in 2019 to 66 in 2020–21.
- Currently, there are no states in the aspirant and achiever category; 15 states/UTs are in the performer category and 22 states/UTs in the front runner category.
- India saw significant improvement in the SDGs related to clean energy, urban development and health in 2020. However, there has been a major decline in the areas of industry, innovation and infrastructure as well as decent work and economic growth.
State Wise Performance:
- Kerala retained its position at the top of the rankings in the third edition of the index, with a score of 75, followed by Tamil Nadu and Himachal Pradesh, both scoring 72.
- At the other end of the scale, Bihar, Jharkhand and Assam were the worst performing States. However, all States showed some improvement from last year’s scores, with Mizoram and Haryana seeing the biggest gains.


Source: NITI AAYOG
Discover more from Simplified UPSC
Subscribe to get the latest posts sent to your email.


